

Question: Create a boxplot for the data in Exercise 5.1. Exercises 5.1 Calculate the range, the variance, and the standard deviation for data that Katz et
Create a boxplot for the data in Exercise 5.1.
Exercises 5.1
Calculate the range, the variance, and the standard deviation for data that Katz et al. collected on SAT performance without reading the passage. The data follow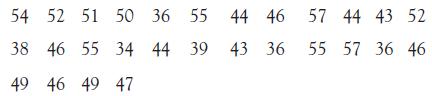
54 52 51 50 36 55 44 46 57 44 43 52 38 46 55 34 49 46 49 47 44 39 43 36 55 57 36 46
Step by Step Solution
There are 3 Steps involved in it
1 Expert Approved Answer
Step: 1 Unlock

Boxp... View full answer
Question Has Been Solved by an Expert!
Get step-by-step solutions from verified subject matter experts
Step: 2 Unlock
Step: 3 Unlock