

Question: Create a boxplot for the data in Exercise 5.2 using R or SPSS if possible. Exercises 5.2 Calculate the range, the variance, and the standard
Create a boxplot for the data in Exercise 5.2 using R or SPSS if possible.
Exercises 5.2
Calculate the range, the variance, and the standard deviation for the Katz et al. data on SAT performance after reading the passage.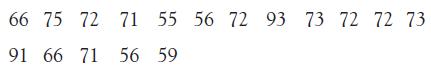
66 75 72 71 55 56 72 93 73 72 72 73 91 66 71 56 59
Step by Step Solution
There are 3 Steps involved in it
1 Expert Approved Answer
Step: 1 Unlock

Question Has Been Solved by an Expert!
Get step-by-step solutions from verified subject matter experts
Step: 2 Unlock
Step: 3 Unlock