

Create a histogram for the data for GPA in Add.dat, using reasonable intervals. You can do this
Question:
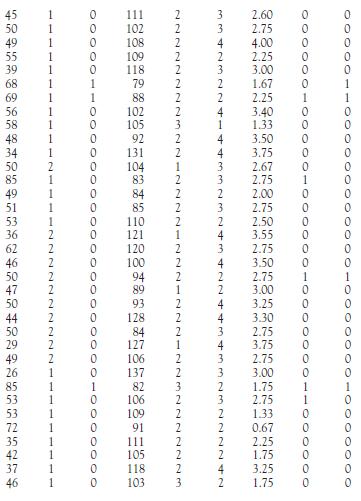
Create a histogram for the data for GPA in Add.dat, using reasonable intervals. You can do this by hand or by using any available software.
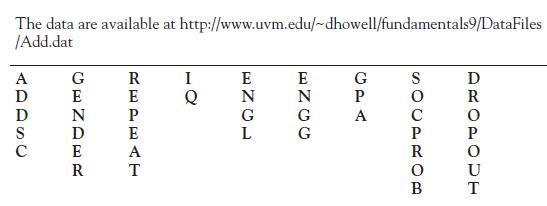
Refer to a large data set in Appendix D. The data can also be downloaded from the Web at https://www.uvm.edu/~dhowell/fundamentals9/DataFiles/Add.dat These data come from a research study by Howell and Huessy (1985), which is described at the beginning of the appendix. We will refer to them throughout the book.
Data Set In Appendix D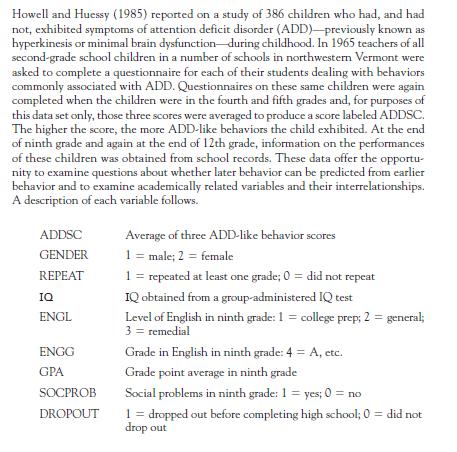
Fantastic news! We've Found the answer you've been seeking!
Step by Step Answer:
His...View the full answer

Answered By
ROHIT K ANIL
Determined, dedicated and enthusiastic electrical engineering tutor. I have a first-class degree in Electrical and Electronics Engineering from Karunya University. I have master’s degree in Electrical and Electronics Engineering with specialisation in Power Electronics from APJ Abdul Kalam Technological University.
I have experience with tutoring engineering projects, specifically solar photovoltaic systems, dc-dc converters, rectifiers, inverters, induction and BLDC motors.
My professional skills include:
• Simulation: MATLAB, LTSpice and Pspice
• PCB Designing: CadSoft Eagle, Autodesk Eagle, Altium Designer and Proteus
• Real-Time Controllers: Arduino UNO, TMS320F2802x and dsPIC30F2010
• Computer-Aided Design: Autodesk AutoCAD, CorelDRAW and SolidWorks
• Programming: C, C++ and Java (basics)
• Project Management: Microsoft Project and Visio
0 Reviews
10+ Question Solved
Related Book For 
Fundamental Statistics For The Behavioral Sciences
ISBN: 9781305652972
9th Edition
Authors: David C. Howell
Question Posted:
