

Create a line graph for each of the following tables of cell means (assume the scores have
Question:
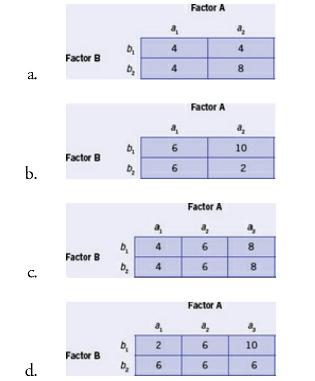
Create a line graph for each of the following tables of cell means (assume the scores have a possible range of 0 to 10 and put Factor \(\mathrm{A}\) along the \(\mathrm{X}\) (horizontal) axis).
Fantastic news! We've Found the answer you've been seeking!
Step by Step Answer:

Answered By
Lisper Wanja
I am an experienced and highly motivated writer with a passion for the skills listed. I have a proven track record of my expertise and my aim is to deliver quality, well-detailed and plagiarism free projects. My genuine passion for writing combined with my ongoing professional development through school and research makes me an ideal candidate within for any assignment.
233+ Reviews
388+ Question Solved
Related Book For 
Fundamental Statistics For The Social And Behavioral Sciences
ISBN: 9781483318790
1st Edition
Authors: Howard T. Tokunaga
Question Posted:
