

Question: Create a scatterplot of the data in Exercise 13.6, and compute the correlation between the two sets of scores. What does this say that is
Create a scatterplot of the data in Exercise 13.6, and compute the correlation between the two
sets of scores. What does this say that is relevant to the answer to Exercise 13.7?
Exercise 13.7
Why would you use a paired t test in Exercise 13.6?
Exercise 13.6
Hoaglin, Mosteller, and Tukey (1983) present data on blood levels of beta-endorphin as a
function of stress. They took beta-endorphin levels for 19 patients 12 hours before surgery and
again 10 minutes before surgery. The data are presented on the next page, in fmol/ml: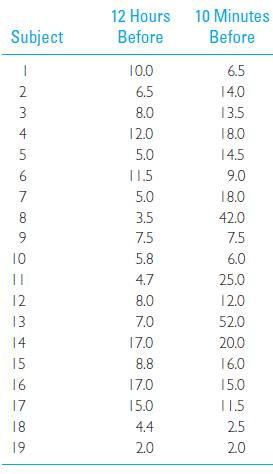
Subject 12 Hours Before 10 Minutes Before -234567 10.0 6.5 6.5 14.0 8.0 13.5 12.0 18.0 5.0 14.5 11.5 9.0 5.0 18.0 8 3.5 42.0 9 7.5 7.5 10 5.8 6.0 || 4.7 25.0 12 8.0 12.0 13 7.0 52.0 14 17.0 20.0 15 8.8 16.0 16 17.0 15.0 17 15.0 11.5 18 4.4 25 19 2.0 20
Step by Step Solution
3.34 Rating (151 Votes )
There are 3 Steps involved in it
As the correlation between ... View full answer

Get step-by-step solutions from verified subject matter experts