

Question: For the data in Exercise 13.1, create a scatterplot and calculate the correlation between husbands and wifes sexual satisfaction. How does this amplify what we
For the data in Exercise 13.1, create a scatterplot and calculate the correlation between husband’s
and wife’s sexual satisfaction. How does this amplify what we have learned from the
analysis in Exercise 13.1? (For example, in R the commands would be plot(wife ~ Husband)
and cor (Wife, Husband.))
Exercise 13.1
Hout, Duncan, and Sobel (1987) reported on the relative sexual satisfaction of married couples.
They asked each member of 91 married couples to rate the degree to which they agreed
with “Sex is fun for me and my partner” on a four-point scale ranging from “never or occasionally”
to “almost always.” The data appear below (I know it’s a lot of data, but it’s an interesting
question, and the data can always be downloaded from the book’s website.):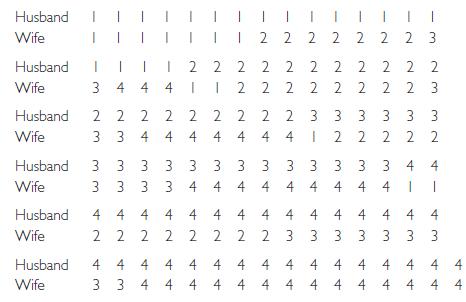
Start out by running a matched-sample t test on these data. Why is a matched-sample test
appropriate?
- - - Wife Husband Wife II 2 2 2 2 2 2 2 3 ||||222 2 2 2 2 2 2 2 2 3 4 4 4 1 1 2 2 2 2 2 2 2 2 3 Husband 2 2 2 2 2 2 2 2 2 3 3 3 3 3 3 3 3 4 4 4 4 4 4 4 1 222 22 Husband Wife Husband Wife 3 3 3 3 3 3 3 3 3 3 3 3 3 4 4 3 3 3 3 4 4 4 4 4 4 4 4 411 Husband 4 4 4 4 4 4 4 4 4 4 4 4 4 4 4 Wife 2 2 2 2 2 2 2 2 3 3 3 3 3 3 3 Husband 4 4 4 4 4 4 4 4 4 4 4 4 4 4 4 4 Wife 3 3 4 4 4 4 4 4 4 4 4 4 4 4 4 4
Step by Step Solution
3.30 Rating (147 Votes )
There are 3 Steps involved in it
The most important thing about a t test is the assumption that the mean ... View full answer

Get step-by-step solutions from verified subject matter experts