

The following data represent the total federal debt (in trillions of dollars) of the United States from
Question:
The following data represent the total federal debt (in trillions of dollars) of the United States from 2000 to 2018.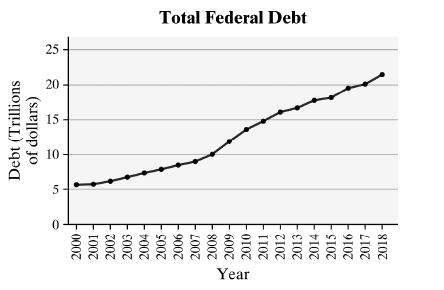
(a) Construct a time-series plot of the data.
(b) Percentage change may be found using the formula:
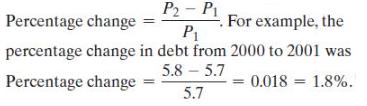
That Is, the debt increased 1.8% from 2000 to 2001. What was the percentage change in debt from 2008 to 2009? Have there been any years when the debt decreased (since 2000)?
Fantastic news! We've Found the answer you've been seeking!
Step by Step Answer:
a b No there have not been any years when the ...View the full answer

Answered By
MICHAEL KICHE
I was employed studypool for the first time in tutoring. I did well since most of my students and clients got the necessary information and knowledge requested for. I always submitted the answers in time and followed the correct formatting in answering eg MLA or APA format,
Again I worked with the writers bay where I did writing and got many clients whom we worked with so closely. They enjoyed every single service I delivered to them. My answers are always correct.
13+ Reviews
52+ Question Solved
Related Book For 

Question Posted:
