

Given the importance of advertising and products related to the Super Bowl, one company (www.itsasurvey.com) commissioned a
Question:
Given the importance of advertising and products related to the Super Bowl, one company (www.itsasurvey.com) commissioned a survey asking people to indicate their favorite snack to eat during the game. You're interested in seeing whether your friends expressed the same preferences so you visit several parties and see what people are choosing to eat. Here are your findings:
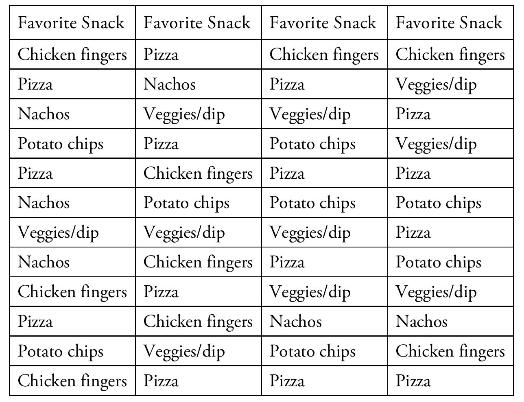
a. Construct a frequency distribution table for these data (put the percentage [\%] of each snack on the Y-axis).
Fantastic news! We've Found the answer you've been seeking!
Step by Step Answer:

Answered By
Joan Gakii
I'm a meticulous professional writer with over five years writing experience. My skill set includes
- Digital Content,
- Interpersonal Communication,
- Web Content and academic Writing,
- Proofreading,
- Editing,
- Project Management, and
- Public Relations.
7+ Reviews
12+ Question Solved
Related Book For 
Fundamental Statistics For The Social And Behavioral Sciences
ISBN: 9781483318790
1st Edition
Authors: Howard T. Tokunaga
Question Posted:
