

An instructor wants to examine the distribution of grades students receive in her classes: a. Construct a
Question:
An instructor wants to examine the distribution of grades students receive in her classes:
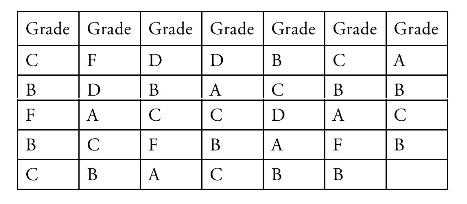
a. Construct a frequency distribution table for these data and a bar chart of these data (put the percentage [\%] of each grade on the Y-axis).
Fantastic news! We've Found the answer you've been seeking!
Step by Step Answer:

Answered By
Nazrin Ziad
I am a post graduate in Zoology with specialization in Entomology.I also have a Bachelor degree in Education.I posess more than 10 years of teaching as well as tutoring experience.I have done a project on histopathological analysis on alcohol treated liver of Albino Mice.
I can deal with every field under Biology from basic to advanced level.I can also guide you for your project works related to biological subjects other than tutoring.You can also seek my help for cracking competitive exams with biology as one of the subjects.
2+ Reviews
10+ Question Solved
Related Book For 
Fundamental Statistics For The Social And Behavioral Sciences
ISBN: 9781483318790
1st Edition
Authors: Howard T. Tokunaga
Question Posted:
