

In Section 6.4 I said that T scores are designed to have a mean of 50 and
Question:
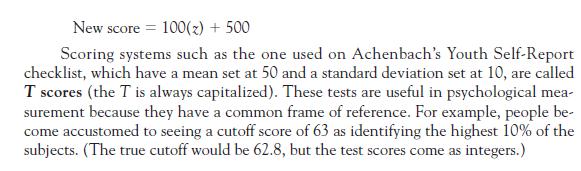
In Section 6.4 I said that T scores are designed to have a mean of 50 and a standard deviation of 10 and that the Achenbach Youth Self-Report measure produces T scores. The data in Figure 6.3 do not have a mean and standard deviation of exactly 50 and 10. Why do you suppose that this is so?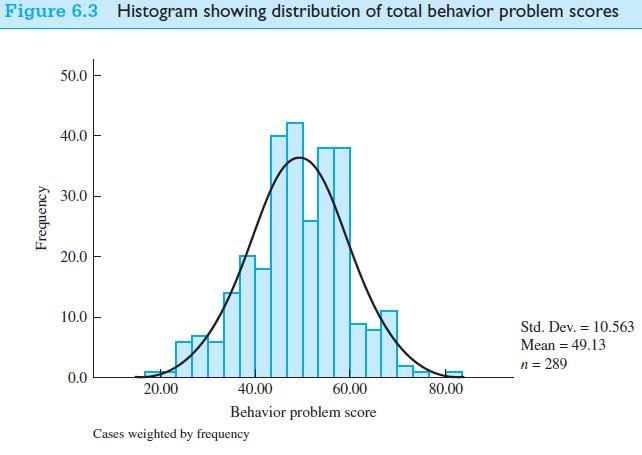
Section 6.4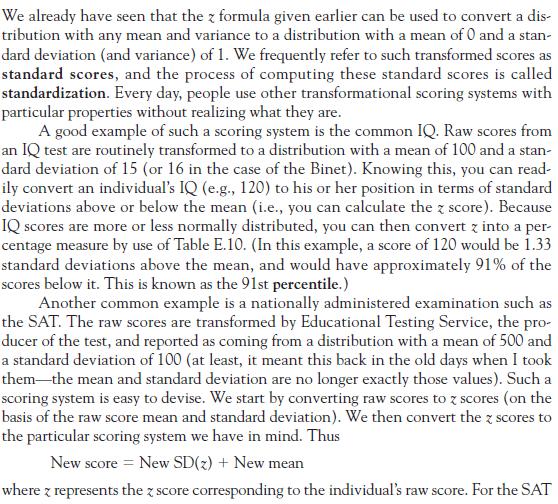
Fantastic news! We've Found the answer you've been seeking!
Step by Step Answer:

Answered By
Rohan Kr
Tutoring experience - I am a tutor for past 3 years. Botany and biology is my subject. I also did online tutoring for 6 months.
Educational experience - I am a under post graduate in Botany studying in Ramakrishna Mission Vivekananda Centenary college ,Rahara. I am in my final semester. Phycology is my special paper.
I did my graduation from Asutosh College, University of Calcutta in Botany (Hons).
0 Reviews
10+ Question Solved
Related Book For 
Fundamental Statistics For The Behavioral Sciences
ISBN: 9781305652972
9th Edition
Authors: David C. Howell
Question Posted:
