The data in the next column shows birth rate and per capita income (in thousands of 2012
Question:
The data in the next column shows birth rate and per capita income (in thousands of 2012 dollars) from 2005 through 2017. Draw a time-series plot for both birth rate and per capita income. Comment on any trends.
Transcribed Image Text:
Year 2005 2006 2007 2008 2009 2010 2011 2012 2013 2014 2015 2016 2017 Birth Rate (births per 1000 women age 15-44) 14.0 14.3 14.3 14.0 13.5 13.0 12.7 12.6 12.4 12.5 12.4 12.2 11.8 Per Capita Income (thousands of 2012 dollars) 36.5 37.6 38.1 38.1 37.7 38.2 38.8 40.0 39.0 40.3 41.6 42.0 42.8
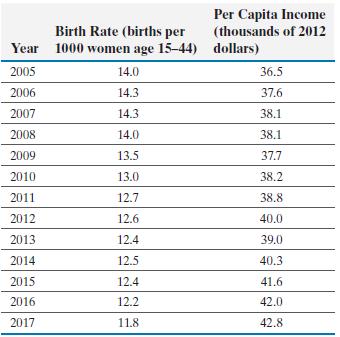
Fantastic news! We've Found the answer you've been seeking!
Step by Step Answer:
Answer rating: 55% (9 reviews)
As per capita income increases birth rate appe...View the full answer
Answered By
Shubhradeep Maity
I am an experienced and talented freelance writer passionate about creating high-quality content. I have over five years of experience working in the field and have collaborated with several renowned companies and clients in the SaaS industry.
At Herman LLC, an online collective of writers, I generated 1,000+ views on my content and created journal content for 100+ clients on finance topics. My efforts led to a 60% increase in customer engagement for finance clients through revamping website pages and email interaction.
Previously, at Gerhold, a data management platform using blockchain, I wrote and published over 50 articles on topics such as Business Finance, Scalability, and Financial Security. I managed four writing projects concurrently and increased the average salary per page from $4 to $7 in three months.
In my previous role at Bernier, I created content for 40+ clients within the finance industry, increasing sales by up to 40%.
I am an accomplished writer with a track record of delivering high-quality content on time and within budget. I am dedicated to helping my clients achieve their goals and providing exceptional results.
5.00+
1+ Reviews
10+ Question Solved
Related Book For
Question Posted:
Students also viewed these Business questions
-
The file contains the data in the next column about the cost of electricity during July 2010 for a random sample of 50 one-bedroom apartments in a large city. a. Construct a frequency distribution...
-
Let x be per capita income in thousands of dollars. Let y be the number of medical doctors per 10,000 residents. Six small cities in Oregon gave the following information about x and y (Based on...
-
A time series plot similar to the one shown next appeared in a recent advertisement for a well-known golf magazine. One person might interpret the plot's message as the longer you subscribe to the...
-
Kamloops Company is a grocery wholesaler and is planning to expand its operations. The company has asked the bank for a loan to finance the expansion. Alphonzo, the companys manager, has prepared the...
-
Repeat M7-16, except assume the 2015 ending inventory was over stated by $ 100,000. Refer M7-16 Assume the 2015 ending inventory of Sheas Shrimp Shack was understated by $ 10,000. Explain how this...
-
Use Eulers method to approximate the indicated function value to 3 decimal places, using h = 0.1. dy dx = 2xV1 + y; y(1) = 2; find y(1.5)
-
In 2001, the City of New York and the Dormitory Authority of the State of New York (DASNY) entered into an agreement to build a forensic biology laboratory in Manhattan. Per the agreement, DASNY...
-
The following events apply to Equipment Services Inc. in its first year of operation: 1. Acquired $60,000 cash from the issue of common stock. 2. Received a $8,200 cash advance for services to be...
-
Gradient of the Rayleigh Quotient For a symmetric matrix A and a nonzero vector , the Rayleigh Quotient is defined by xT Ax xTx In the case where is an eigenvector, then the Rayleigh Quotient will...
-
Define each of the following terms: a. Data b. Information c. Metadata d. Enterprise resource planning e. Data warehouse f. Constraint g. Database h. Entity i. Database management system j....
-
The following time-series plot shows the annual unemployment and inflation rates for the years 2001 through 2017 (a) Estimate the unemployment rate in 2012. (b) In what year was the unemployment rate...
-
The table shows the homeownership rate in each of the 50 states and Washington, DC, in 2017. The state with the highest homeownership rate is West Virginia and the lowest is Washington, DC. With a...
-
Evaluate the integral. 5 Se dx -5
-
Why is a strong online presence important? How can developing our website affect us and our customers? How can we monitor progress to see the impact of changes? Explain.
-
Consider the following as to how each would effect the estate tax return for Allen's estate: Allen's will also provided that a trust be created and funded with $500,000. The terms of the trust...
-
Why did Perrow thinks that welfare agencies such as mental health hospitals are established for the purpose of being able to stay there are actions in place for problems?
-
Why did Philadelphia Energy Solutions file for bankruptcy? Could they have used different risk management strategies to avoid a bankruptcy filing? If so, which ones and why?
-
Why do you believe leaders are born, or is leadership a learned skill? In addition to using two sources, such as the articles by Goleman and Kirkpatrick, support your response with a specific...
-
Why are loyalty programs considered to be a direct-marketing program rather than a sales promotion?
-
Assume a simple Keynesian depression economy with a multiplier of 4 and an initial equilibrium income of $3,000. Saving and investment equal $400, and assume full employment income is $4,000. a. What...
-
A survey of adult men and women asked, Which one of the following jobs would you most like to have? The results of the survey are shown in the table. (a) Construct a relative frequency distribution...
-
Automotive is a major supplier of paint to the automotive industry. A survey of 100 randomly selected autos in the luxury car segment and 100 randomly selected autos in the sports car segment that...
-
The table shows the gold medal winners in hockey in the Winter Olympics since 1920. (a) Construct a frequency distribution. (b) Construct a relative frequency distribution. (c) Construct a frequency...
-
Here are the abbreviated financial statements for Planner's Peanuts: INCOME STATEMENT, 2019 Sales Cost Net income $6,000 4,700 $1,300 BALANCE SHEET, YEAR-END Assets 2018 $9,500 2019 $10,000 Debt...
-
The dyes synthesized today have acidic and basic functional groups. A dye molecule is shown with its functional groups in their most acidic form with pKa's labeled. 2 pts Taking into account the...
-
When looking at the definition of a concentration strategy, it says when organizations try to compete in a single industry. However, Nestle has chosen to expand in related diversification strategies,...
Study smarter with the SolutionInn App