

The following time-series plot shows the annual unemployment and inflation rates for the years 2001 through 2017
Question:
The following time-series plot shows the annual unemployment and inflation rates for the years 2001 through 2017
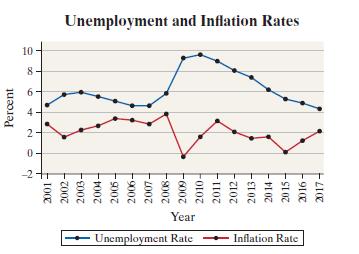
(a) Estimate the unemployment rate in 2012.
(b) In what year was the unemployment rate highest?
(c) In what year was the inflation rate highest?
(d) In what year were the unemployment rate and inflation rate furthest apart?
(e) The misery index is defined as the sum of the unemployment rate and the inflation rate. According to the misery index, which year was more “miserable”, 2008 or 2011?
Fantastic news! We've Found the answer you've been seeking!
Step by Step Answer:
a From the graph it appears the unemployment rate in 2012 was about 8 b The highest unempl...View the full answer

Answered By
Muhammad Umair
I have done job as Embedded System Engineer for just four months but after it i have decided to open my own lab and to work on projects that i can launch my own product in market. I work on different softwares like Proteus, Mikroc to program Embedded Systems. My basic work is on Embedded Systems. I have skills in Autocad, Proteus, C++, C programming and i love to share these skills to other to enhance my knowledge too.
1+ Reviews
10+ Question Solved
Related Book For 

Question Posted:
