

The following data represent the number of days between grocery orders at the online delivery company Instacart.
Question:
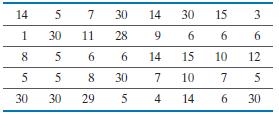
The following data represent the number of days between grocery orders at the online delivery company Instacart. Determine the shape of the distribution of days between orders by drawing a frequency histogram. Find the mean and median days between orders Which measure of central tendency better describes days between orders?
Fantastic news! We've Found the answer you've been seeking!
Step by Step Answer:
To create the histogram we choose the lower class limit ...View the full answer

Answered By
Ankit Mahajan
I am an electrical engineering graduate from Thapar institute of engineering and technology.
Qualified exams - GATE 2019,2020.
CAT EXAM 2021- 91.4 percentile
SSC EXAMS- 2019,2020,2021
AFCAT EXAM- 2019,2020,2021
I want to share my knowledge with other people so that they can achieve the same.
I have strong hold Mathematics, Electrical engineering and all the subjects related.
Just give me a problem and I will give you the solution of it.
1+ Reviews
10+ Question Solved
Related Book For 

Question Posted:
