

The following data represent U.S. college enrollments by census categories as measured in 1982, 1991, and 2005.
Question:
The following data represent U.S. college enrollments by census categories as measured in 1982, 1991, and 2005. (The 2005 data are approximate.) Plot the data in a form that represents the changing enrollment patterns of college students in the United States from 1982 to 2005. (The data entries are in 1,000s, and the 1991 data are shown simply for your information.)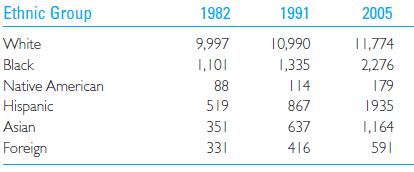
You can find additional longitudinal data at http://trends.collegeboard.org/education-pays/figures-tables/immediateenrollment-
rates-race-ethnicity-1975-2008
Step by Step Answer:

This question has not been answered yet.
You can Ask your question!
Related Book For 

Fundamental Statistics For The Behavioral Sciences
ISBN: 9781305652972
9th Edition
Authors: David C. Howell
Question Posted:
