

The graphic below and the graphic on the following page represent the number of reported shark attacks
Question:
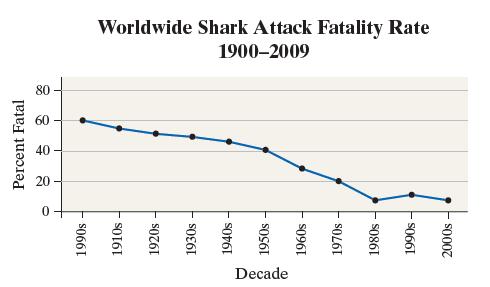
The graphic below and the graphic on the following page represent the number of reported shark attacks and fatality rate worldwide since 1900. Write a report about the trends in the graphs. In your report discuss the apparent contradiction between the increase in shark attacks, but the decrease in fatality rate.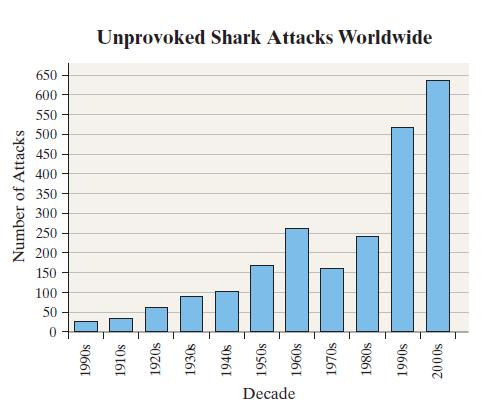
Fantastic news! We've Found the answer you've been seeking!
Step by Step Answer:
Reports should address the fact that the number of people going to the beach and ...View the full answer

Answered By
Sinmon Warui Kamau
After moving up and down looking for a job, a friend introduced me to freelance writing. I started with content writing and later navigated to academic writing. I love writing because apart from making a living out of it, it is also a method of learning and helping others to learn.
40+ Reviews
45+ Question Solved
Related Book For 

Question Posted:
