

Question: Draw a dot plot of the waiting data from Problem 26. The data below represents the number of customers waiting for a table at 6:00
Draw a dot plot of the waiting data from Problem 26.
The data below represents the number of customers waiting for a table at 6:00 p.m. for 40 consecutive Saturdays at Bobak’s Restaurant.
The data below represent the number of customers waiting for a table at 6:00 p.m. for 40 consecutive Saturdays at Bobak’s Restaurant.
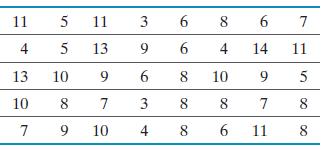
11 4 13 10 7 5 11 5 13 10 9 8 7 3 9 10 4 3 9 6 8 6 8 6 6 4 14 10 00 8 8 6 9 7 11 7 11 5 8 8
Step by Step Solution
★★★★★
3.33 Rating (168 Votes )
There are 3 Steps involved in it
1 Expert Approved Answer
Step: 1 Unlock

C30 3 1000 Customers ... View full answer
Question Has Been Solved by an Expert!
Get step-by-step solutions from verified subject matter experts
Step: 2 Unlock
Step: 3 Unlock