

Question: By the method used to graph Figure 12-20, plot ln P versus 1/T for liquid white phosphorus, and estimate (a) Its normal boiling point and
By the method used to graph Figure 12-20, plot ln P versus 1/T for liquid white phosphorus, and estimate
(a) Its normal boiling point and
(b) Its enthalpy of vaporization, ΔvapH, in kJ mol-1. Vapor pressure data: 76.6 °C, 1 mmHg; 128.0 °C, 10 mmHg; 166.7 °C, 40 mmHg; 197.3 °C, 100 mmHg; 251.0 °C, 400 mmHg.
Figure 12-20
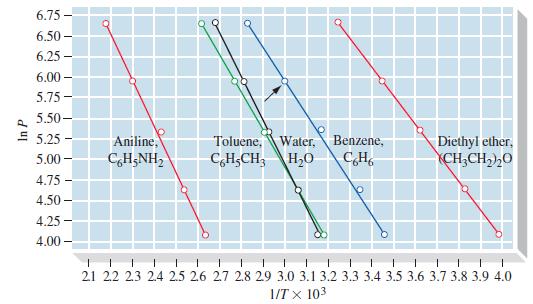
6.75- 6.50- 6.25 6.00- 5.75- 5.50- E 5.25- 5.00- 4.75 4.50- 4.25- 4.00- - Q Aniline, CHNH, 09 Toluene, Water, C6H-CH3 HO Q Benzene, CH Diethyl ether, CH3CH)20 1 1 1 1 1 1 I 1 1 1 1 1 T 1 21 22 23 2.4 2.5 2.6 2.7 2.8 2.9 3.0 3.1 3.2 3.3 3.4 3.5 3.6 3.7 3.8 3.9 4.0 1/TX 103
Step by Step Solution
3.31 Rating (160 Votes )
There are 3 Steps involved in it
To plot ln P versus 1T for liquid white phosphorus we first ... View full answer

Get step-by-step solutions from verified subject matter experts