

Sketch the titration curves that you would expect to obtain in the following titrations. Select a suitable
Question:
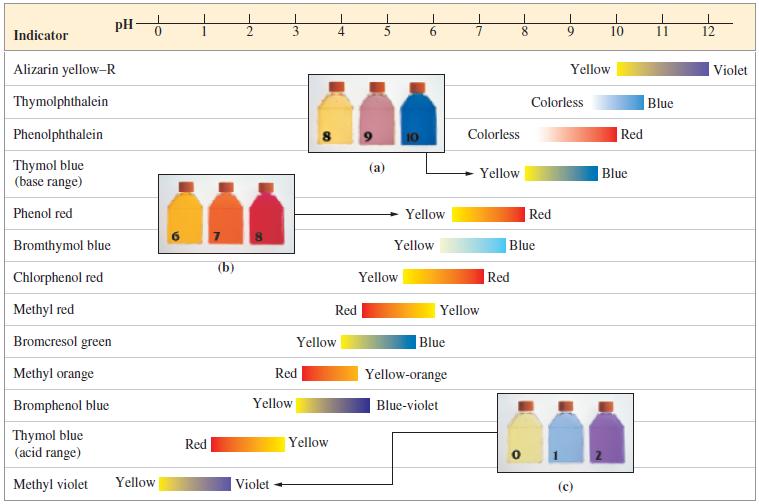
Sketch the titration curves that you would expect to obtain in the following titrations. Select a suitable indicator for each titration from Figure 17-7.
(a) NaOH(aq) titrated with HNO3(aq)
(b) NH3(aq) titrated with HCl(aq)
(c) CH3COOH(aq) titrated with KOH(aq)
(d) NaH2PO4(aq) titrated with KOH(aq).
Figure 17-7
Step by Step Answer:

This question has not been answered yet.
You can Ask your question!
Related Book For 
General Chemistry Principles And Modern Applications
ISBN: 9780132931281
11th Edition
Authors: Ralph Petrucci, Jeffry Madura, F. Herring, Carey Bissonnette
Question Posted:
