

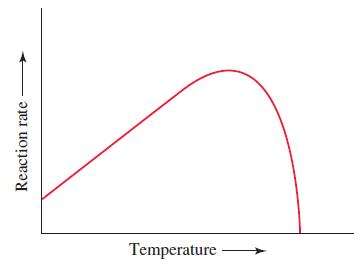
The graph shows the effect of temperature on enzyme activity. Explain why the graph has the general
Question:
The graph shows the effect of temperature on enzyme activity. Explain why the graph has the general shape shown. For human enzymes, at what temperature would you expect the maximum in the curve to appear?
Fantastic news! We've Found the answer you've been seeking!
Step by Step Answer:
The graph shows the effect of temperature on enzyme activity The general shape of the graph is due to two competing factors Increased temperature incr...View the full answer

Answered By
Rashul Chutani
I have been associated with the area of Computer Science for long. At my university, I have taught students various Computer Science Courses like Data Structures, Algorithms, Theory of Computation, Digital Logic, System Design, and Machine Learning. I also write answers to questions posted by students in the area of and around Computer Science.
I am highly fortunate to receive great feedback on my teaching skills that keeps me motivated. Once a student sent me an email stating that I had explained to him a concept better than his professor did.
I believe in the fact that "Teaching is the best way to learn". I am highly fascinated by the way technology nowadays is solving real-world problems and try to contribute my bit to the same.
Besides tutoring, I am a researcher at the Indian Institute of Technology. My present works are in the area of Text Summarization and Signal and Systems.
Some of my achievements include clearing JEE Advanced with an All India Rank of 306 out of 1.5 million contesting candidates and being the Department Ranker 1 at my University in the Department of Computer Science and Engineering.
I look forward to providing the best Tutoring Experience I can, to the student I teach.
1+ Reviews
10+ Question Solved
Related Book For 

General Chemistry Principles And Modern Applications
ISBN: 9780132931281
11th Edition
Authors: Ralph Petrucci, Jeffry Madura, F. Herring, Carey Bissonnette
Question Posted:
