

Which of the following visualizations best represents the distribution of O 2 and SO 2 molecules near
Question:
Which of the following visualizations best represents the distribution of O2 and SO2 molecules near an orifice some time after effusion occurs in the direction indicated by the arrows? The initial condition was one of equal numbers of O2 molecules ![]() and SO2 molecules
and SO2 molecules![]() on the left side of the orifice. Explain.
on the left side of the orifice. Explain.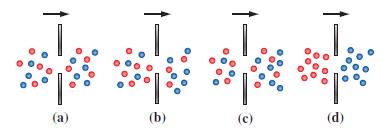
Fantastic news! We've Found the answer you've been seeking!
Step by Step Answer:

Answered By
Sarah Khan
My core expertise are:
-_ Finance
-_ Business
-_ Management
-_ Marketing Management
-_ Financial Management
-_ Corporate Finance
-_ HRM etc...
I have 7+ years of experience as an online tutor. I have hands-on experience in handling:
-_ Academic Papers
-_ Research Paper
-_ Dissertation Paper
-_ Case study analysis
-_ Research Proposals
-_ Business Plan
-_ Complexed financial calculations in excel
-_ Home Work Assistance
-_ PPT
-_ Thesis Paper
-_ Capstone Papers
-_ Essay Writing etc...
91+ Reviews
92+ Question Solved
Related Book For 
General Chemistry Principles And Modern Applications
ISBN: 9780132931281
11th Edition
Authors: Ralph Petrucci, Jeffry Madura, F. Herring, Carey Bissonnette
Question Posted:
