

Question: Based on Figure 4.7, derive a relationship between the thickness of the thin layer in time domain and the spacing of the notches in the
Based on Figure 4.7, derive a relationship between the thickness of the thin layer in time domain and the spacing of the notches in the amplitude spectrum.
Figure 4.7
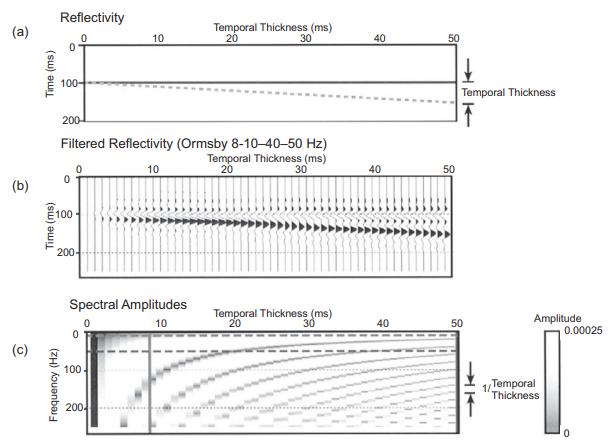
G (a) Time (ms) Reflectivity 0 0 100- 10 Temporal Thickness (ms) 20 30 40 50 (b) 200 Filtered Reflectivity (Ormsby 8-10-40-50 Hz) 0 0 10 Temporal Thickness (ms) 20 30 40 50 Frequency (Hz) Time (ms) 100 200- Spectral Amplitudes 100 0 0 200- Temporal Thickness T Temporal Thickness (ms) 10 20 30 40 50 Amplitude 0.00025 Temporal Thickness 0
Step by Step Solution
★★★★★
3.34 Rating (166 Votes )
There are 3 Steps involved in it
1 Expert Approved Answer
Step: 1 Unlock

Question Has Been Solved by an Expert!
Get step-by-step solutions from verified subject matter experts
Step: 2 Unlock
Step: 3 Unlock