

Question: The figure to the right shows a perfectly competitive firm's marginal cost curve (MC), average fixed cost curve (AFC), average variable cost curve (AVC),
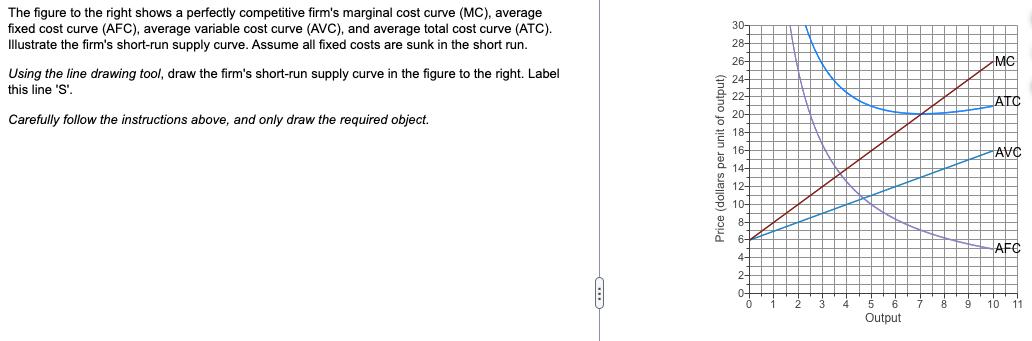
The figure to the right shows a perfectly competitive firm's marginal cost curve (MC), average fixed cost curve (AFC), average variable cost curve (AVC), and average total cost curve (ATC). Illustrate the firm's short-run supply curve. Assume all fixed costs are sunk in the short run. Using the line drawing tool, draw the firm's short-run supply curve in the figure to the right. Label this line 'S'. Carefully follow the instructions above, and only draw the required object. (...) Price (dollars per unit of output) 30- 284 26- 24- 22 20- 18+ 16- 14- 12- 10- 8- 6- 5 5 4- 2- 0- 0 ++++ 5 6 7 Output 8 9 MC ATC AVC AFC 10 11
Step by Step Solution
3.44 Rating (163 Votes )
There are 3 Steps involved in it
The shortrun supply curve for a perfectly competitive firm is u... View full answer

Get step-by-step solutions from verified subject matter experts