

Question: The table shows how students get to school. a. Explain why a circle graph is appropriate for the data. b. You will represent each method
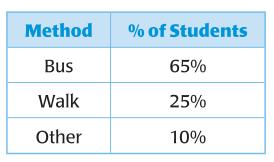
The table shows how students get to school.
a. Explain why a circle graph is appropriate for the data.
b. You will represent each method by a sector of a circle graph. Find the central angle to use for each sector. Then use a protractor and a compass to construct the graph. Use a radius of 2 inches.
c. Find the area of each sector in your graph.
Method Bus Walk Other % of Students 65% 25% 10%
Step by Step Solution
3.39 Rating (174 Votes )
There are 3 Steps involved in it
a Explanation of why a circle graph is appropriate for the data A circle graph also known as a pie chart is appropriate for this data because it repre... View full answer

Get step-by-step solutions from verified subject matter experts