

Question: PhD program acceptance rates by year In exerciseR1.12 we examined data from the TheGradCafe.com. Here, well examine PhD program self-reported annual acceptance rates for each
PhD program acceptance rates by year In exerciseR1.12 we examined data from the TheGradCafe.com. Here, we’ll examine PhD program self-reported annual acceptance rates for each year from 2006 to 2020 for individuals who did their undergraduate studies in the United States.
c) Let’s classify the eruptions as “long” or “short,” depending on whether they last more than 3 minutes or not.
Describe what you see in the comparative boxplots.
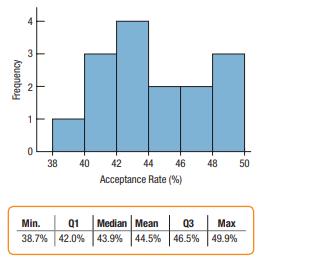
a) Does it appear that a Normal distribution would be appropriate for these data? Explain.
b) Use the summary statistics and the histogram to create a boxplot for these data.
c) Why might these acceptance rates differ from actual acceptance rates of most PhD programs?
Frequency 3 2 0 38 40 42 44 46 48 Acceptance Rate (%) Min. Q1 Median Mean 03 Max 38.7% 42.0% 43.9% 44.5 % 46.5% 49.9% 50 50
Step by Step Solution
There are 3 Steps involved in it

Get step-by-step solutions from verified subject matter experts