

Question: Ratings, again. Here is a bar chart summarizing the 2005 movie ratings, as seen in the pie chart in Exercise 6. a) Which was the
Ratings, again. Here is a bar chart summarizing the 2005 movie ratings, as seen in the pie chart in Exercise 6.
a) Which was the least common rating?
b) An editorial claimed that there s been a growth in PG13 rated films that, according to the writer, have too much sex and violence, at the expense of G-rated films that offer good, clean fun. The writer offered the bar chart below as evidence to support his claim.
Does the bar chart support his claim? Explain.
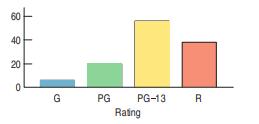
60 40 20 0 G PG PG-13 R Rating
Step by Step Solution
There are 3 Steps involved in it
1 Expert Approved Answer
Step: 1 Unlock

Question Has Been Solved by an Expert!
Get step-by-step solutions from verified subject matter experts
Step: 2 Unlock
Step: 3 Unlock