

Question: TVs and life expectancy Exercise 18 revisited the relationship between life expectancy and TVs per capita and saw that re-expression to the square root of
TVs and life expectancy Exercise 18 revisited the relationship between life expectancy and TVs per capita and saw that re-expression to the square root of TVs per capita made the plot more nearly straight. But was that the best choice of re-expression? Here is a scatterplot of life expectancy vs. the logarithm base 10 of TVs per person. How can you tell that this re-expression is too far along the Ladder of Powers?
(Data in Doctors and life expectancy)
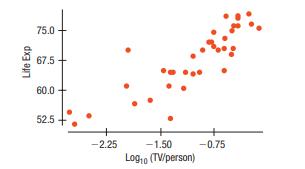
Life Exp 75.0 67.5+ 60.0+ 52.5 -2.25 -1.50 Log10(TV/person) -0.75
Step by Step Solution
There are 3 Steps involved in it
1 Expert Approved Answer
Step: 1 Unlock

Question Has Been Solved by an Expert!
Get step-by-step solutions from verified subject matter experts
Step: 2 Unlock
Step: 3 Unlock