

Question: Create the following 6 financial analysis reports for Casey Corporation and provide an analysis as requested: a. Income Statement (Horizontal) report with a run date
Create the following 6 financial analysis reports for Casey Corporation and provide an analysis as requested:
a. Income Statement (Horizontal) report with a run date of 12/31/€“. Provide a narrative analysis of this report in a manner similar to that done in the chapter. Use your own words based on the information provided in this report.
b. Income Statement (Vertical) report with a run date of 12/31/€“. Provide a narrative analysis of this report in a manner similar to that done in the chapter. Use your own words based on the information provided in this report.
c. Balance Sheet (Horizontal) report with a run date of 12/31/€“. Provide a narrative analysis of this report in a manner similar to that done in the chapter. Use your own words based on the information provided in this report.
d. Balance Sheet (Vertical) report with a run date of 12/31/€“. Provide a narrative analysis of this report in a manner similar to that done in the chapter. Use your own words based on the information provided in this report.
e. Ratio Analysis report with a run date of 12/31/€“. (Use 65,000 shares outstanding and $4.85 price per share) Complete the table below and then provide a narrative analysis of this report in a manner similar to that done in the chapter. Use your own words based on the information provided in this report.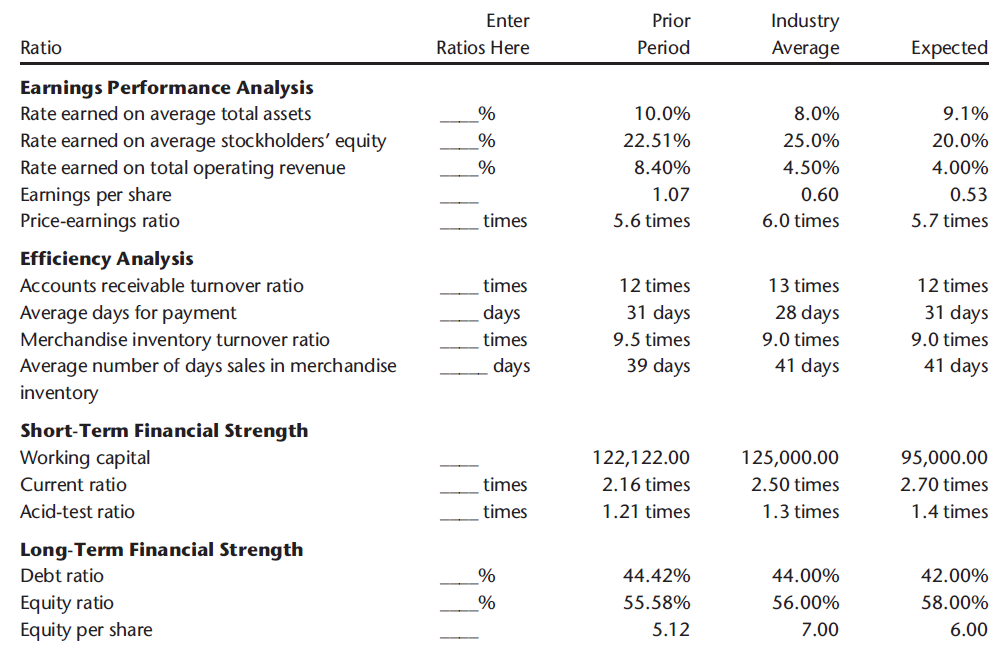 f. Statement of Cash Flows report with a run date of 12/31/€“. Provide a narrative analysis of this report in a manner similar to that done in the chapter. Use your own words based on the information provided in this report.
Industry Average Prior Enter Ratio Ratios Here Period Expected Earnings Performance Analysis Rate earned on average total assets 9.1% 10.0% 8.0% Rate earned on average stockholders' equity Rate earned on total operating revenue 22.51% 25.0% 20.0% 4.50% 8.40% 4.00% Earnings per share Price-earnings ratio 1.07 0.60 0.53 times 5.6 times 6.0 times 5.7 times Efficiency Analysis Accounts receivable turnover ratio times 12 times 13 times 12 times 31 days 28 days Average days for payment Merchandise inventory turnover ratio Average number of days sales in merchandise inventory 31 days days 9.5 times times 9.0 times 9.0 times 39 days 41 days 41 days days Short-Term Financial Strength 95,000.00 Working capital Current ratio 122,122.00 125,000.00 times 2.16 times 2.50 times 2.70 times Acid-test ratio times 1.21 times 1.3 times 1.4 times Long-Term Financial Strength Debt ratio 44.00% 42.00% 44.42% Equity ratio Equity per share 55.58% 56.00% 58.00% 7.00 5.12 6.00
Step by Step Solution
3.45 Rating (165 Votes )
There are 3 Steps involved in it
a Interpreting this horizontal analysis reveals some significant changes Gross profit increased 2709149 1160 but net income after income tax only increased 144577 208 The question is why Part of the a... View full answer

Get step-by-step solutions from verified subject matter experts