Table 3-1(14-1) in the text shows the percentage undervaluation or overvaluation in the Big Mac, based on
Question:
Table 3-1(14-1) in the text shows the percentage undervaluation or overvaluation in the Big Mac, based on exchange rates in July 2019. Go to the main data repository for the BigMac dataset at https://github.com/TheEconomist/big-mac-data and download the complete dataset. Locate the worksheets showing all data for July 2019 as in Table 14-1, and the corresponding worksheets for July 2018 (one year prior) and July 2014 (five years prior). Focus on the data for nine countries only: Brazil, Canada, Denmark, Eurozone, India, Japan, Mexico, Sweden, and the United States (the base country).
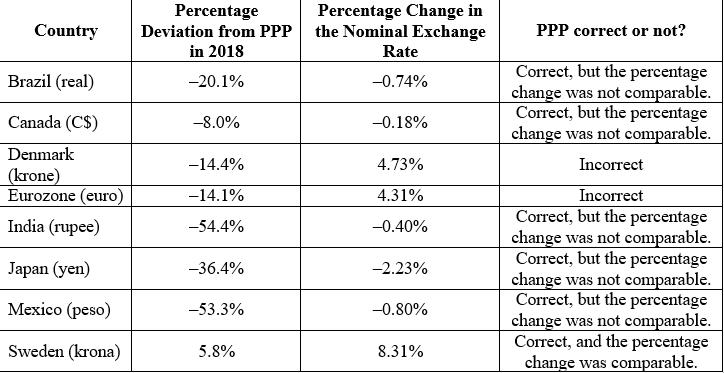
a. Make a table with three columns. In the first column write the first eight country names, excluding the United States. In the second column write the percentage deviation from PPP versus the U.S. dollar in 2018. In the third column report the percentage change in the nominal exchange rate versus the U.S. dollar from 2018 to 2019. How well did PPP deviations in 2018 predict the one-year nominal exchange rate from 2018 to 2019?
b. Now repeat the exercise using 2014 as the start year; report 2014 PPP percentage deviations, and report the percentage change in the nominal exchange rate from 2014 to 2019. How well did PPP deviation in 2014 predict the five-year nominal exchange rate change from 2018 to 2019?
c. Why might the latter prediction work better than the former?
Step by Step Answer:
a The third column is the percentage change in the nominal exchange rate against the US dollar Negat...View the full answer