

Question: Use the data in Table 6.7 to compare U.S. protectionist policies with those of Japan. In what sectors are protection levels relatively equal? Where do
Use the data in Table 6.7 to compare U.S. protectionist policies with those of Japan.
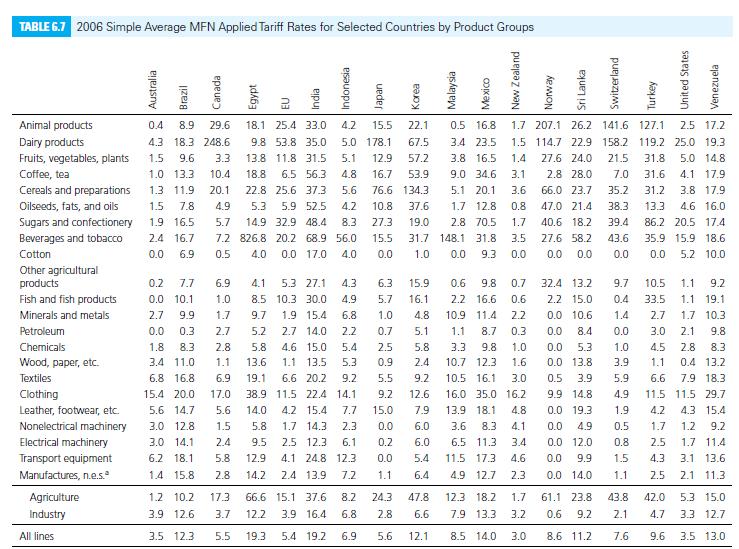
In what sectors are protection levels relatively equal? Where do they differ? Try to explain these patterns.
Australia Brazil Canada Egypt EU India TABLE 6.7 2006 Simple Average MFN Applied Tariff Rates for Selected Countries by Product Groups Indonesia Japan Korea Animal products Dairy products Fruits, vegetables, plants Coffee, tea Cereals and preparations Oilseeds, fats, and oils Sugars and confectionery 0.4 8.9 29.6 18.1 25.4 33.0 4.2 15.5 4.3 18.3 248.6 9.8 53.8 35.0 1.5 9.6 3.3 1.0 13.3 10.4 1.3 11.9 1.5 7.8 20.1 13.8 11.8 31.5 18.8 6.5 56.3 22.8 25.6 37.3 5.6 4.9 5.3 5.9 52.5 4.2 10.8 22.1 5.0 178.1 67.5 5.1 12.9 57.2 4.8 16.7 53.9 76.6 134.3 37.6 0.5 16.8 1.7 207.1 26.2 141.6 127.1 2.5 17.2 3.4 23.5 1.5 114.7 22.9 158.2 119.2 25.0 19.3 3.8 16.5 1.4 27.6 24.0 21.5 31.8 5.0 14.8 9.0 34.6 3.11 2.8 28.0 7.0 31.6 5.1 20.1 3.6 66.0 23.7 4.1 17.9 35.2 31.2 3.8 17.9 1.7 12.8 0.8 47.0 21.4 38.3 13.3 4.6 16.0 1.9 16.5 5.7 14.9 32.9 48.4 8.3 27.3 19.0 2.8 70.5 1.7 40.6 18.2 39.4 86.2 20.5 17.4 Beverages and tobacco 2.4 16.7 7.2 826.8 20.2 68.9 56.0 15.5 31.7 148.1 31.8 3.5 27.6 58.2 43.6 35.9 15.9 18.6 Cotton 0.0 6.9 0.5 4.0 0.0 17.0 4.0 0.0 1.0 0.0 9.3 0.0 0.0 0.0 0.0 0.0 5.2 10.0 Other agricultural products 0.2 7.7 6.9 4.1 5.3 27.1 4.3 6.3 15.9 Fish and fish products 0.0 10.1 1.0 8.5 10.3 30.0 4.9 5.7 16.1 0.6 9.8 0.7 2.2 16.6 0.6 32.4 13.2 9.7 10.5 1.1 9.2 2.2 15.0 0.4 33.5 1.1 19.1 Minerals and metals 2.7 9.9 1.7 9.7 1.9 15.4 6.8 1.0 4.8 10.9 11.4 2.2 0.0 10.6 1.4 2.7 1.7 10.3 Petroleum 0.0 0.3 2.7 5.2 2.7 14.0 2.2 0.7 5.1 1.1 8.7 0.3 0.0 8.4 0.0 3.0 2.1 9.8 Chemicals 1.8 8.3 2.8 5.8 4.6 15.0 5.4 2.5 5.8 3.3 9.8 1.0 0.0 5.3 1.0 4.5 2.8 8.3 Wood, paper, etc. 3.4 11.0 1.1 13.6 1.1 13.5 5.3 0.9 2.4 10.7 12.3 1.6 0.0 13.8 3.9 1.1 0.4 13.2 Textiles 6.8 16.8 6.9 19.1 6.6 20.2 9.2 5.5 9.2 10.5 16.1 3.0 0.5 3.9 5.9 6.6 7.9 18.3 Clothing 15.4 20.0 17.0 38.9 11.5 22.4 14.1 9.2 12.6 16.0 35.0 16.2 9.9 14.8 4.9 11.5 11.5 29.7 Leather, footwear, etc. 5.6 14.7 5.6 14.0 4.2 15.4 7.7 15.0 7.9 13.9 18.1 4.8 0.0 19.3 1.9 4.2 4.3 15.4 Nonelectrical machinery 3.0 12.8 1.5 5.8 1.7 14.3 2.3 0.0 6.0 3.6 8.3 4.1 0.0 4.9 0.5 1.7 1.2 9.2 Electrical machinery 3.0 14.1 2.4 9.5 2.5 12.3 6.1 0.2 6.0 6.5 11.3 3.4 0.0 12.0 0.8 2.5 1.7 11.4 Transport equipment Manufactures, n.e.s. 6.2 18.1 5.8 1.4 15.8 2.8 12.9 4.1 24.8 12.3 0.0 5.4 11.5 17.3 4.6 0.0 9.9 1.5 4.3 3.1 13.6 14.2 2.4 13.9 7.2 1.1 6.4 4.9 12.7 2.3 0.0 14.0 1.1 2.5 2.1 11.3 Agriculture Industry 1.2 10.2 3.9 12.6 17.3 66.6 15.1 37.6 8.2 24.3 47.8 12.3 18.2 1.7 61.1 23.8 43.8 42.0 5.3 15.0 3.7 12.2 3.9 16.4 6.8 2.8 6.6 7.9 13.3 3.2 0.6 9.2 2.1 4.7 3.3 12.7 All lines 3.5 12.3 5.5 19.3 5.4 19.2 6.9 5.6 12.1 8.5 14.0 3.0 8.6 11.2 7.6 9.6 3.5 13.0 Malaysia Mexico New Zealand Norway Sri Lanka Switzerland Turkey United States Venezuela
Step by Step Solution
3.38 Rating (151 Votes )
There are 3 Steps involved in it
Comparing the US and Japans protectionist policies based on the data Relatively Equal Protection Levels Minerals and metals In this sector the US and ... View full answer

Get step-by-step solutions from verified subject matter experts