

Look back at Figure 10-5, specifically at the left part of the figure. How does the historical
Question:
Look back at Figure 10-5, specifically at the left part of the figure. How does the historical trade policy of the United States compare with that of developing countries in the 20th century? Why do you think the results seem to have been so different? 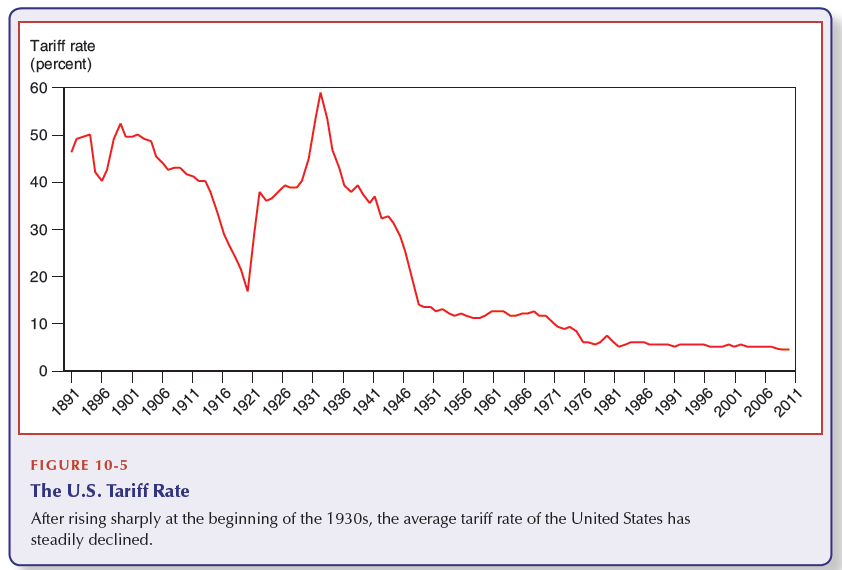
Fantastic news! We've Found the answer you've been seeking!
Step by Step Answer:
The historical trade policy of the United States in terms of tariff rates is fairly similar to that ...View the full answer

Answered By
Utsab mitra
I have the expertise to deliver these subjects to college and higher-level students. The services would involve only solving assignments, homework help, and others.
I have experience in delivering these subjects for the last 6 years on a freelancing basis in different companies around the globe. I am CMA certified and CGMA UK. I have professional experience of 18 years in the industry involved in the manufacturing company and IT implementation experience of over 12 years.
I have delivered this help to students effortlessly, which is essential to give the students a good grade in their studies.
2+ Reviews
10+ Question Solved
Related Book For 

International Economics Theory and Policy
ISBN: 978-0134519579
11th Edition
Authors: Paul R. Krugman, Maurice Obstfeld, Marc Melitz
Question Posted:
