

Question: 23. Oakland passengers 2013 The scatterplot below shows the number of passengers at Oakland (CA) airport month by month since 1997. (www.oaklandairport.com) a) Describe the
23. Oakland passengers 2013 The scatterplot below shows the number of passengers at Oakland (CA) airport month by month since 1997. (www.oaklandairport.com)
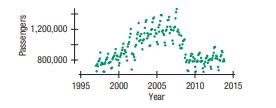
a) Describe the patterns in passengers at Oakland airport that you see in this time plot.
b) Until 2009, analysts got fairly good predictions using a linear model. Why might that not be the case now?
c) If they considered only the data from 2009 to the present, might they get reasonable predictions into the future?
Passengers 1,200,000 H 800,000 1995 2000 2005 2010 2015 Year
Step by Step Solution
There are 3 Steps involved in it
1 Expert Approved Answer
Step: 1 Unlock

Question Has Been Solved by an Expert!
Get step-by-step solutions from verified subject matter experts
Step: 2 Unlock
Step: 3 Unlock