

Question: In Exercise 29, we considered whether a linear model would be appropriate to describe the trend in the number of passengers departing from the Oakland
In Exercise 29, we considered whether a linear model would be appropriate to describe the trend in the number of passengers departing from the Oakland (CA) airport each month since the start of 1997. If we fit a regression model, we obtain this residual plot. We’ve added lines to show the order of the values in time:
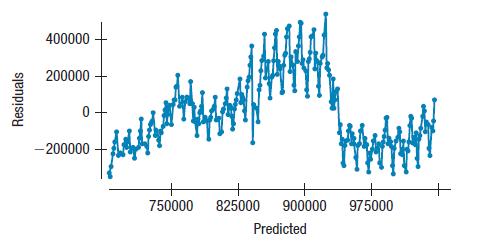
a) Can you account for the pattern shown here?
b) Would a re-expression help us deal with this pattern?
Data From Exercise 29
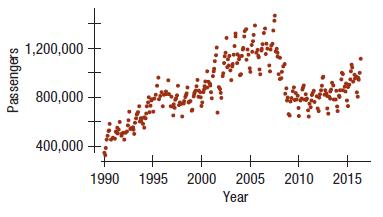
The scatterplot below shows the number of passengers at Oakland (CA) airport month by month since 1997 (oaklandairport.com/news/statistics/passenger-history/).
Residuals 400000 200000 0 -200000 750000 825000 900000 Predicted hadd + 975000
Step by Step Solution
3.37 Rating (166 Votes )
There are 3 Steps involved in it
a The residuals cycle up and down because there is a yearl... View full answer

Get step-by-step solutions from verified subject matter experts