

A regression of the calories in breakfast cereals on their carbohydrate content (g) looks like this: A
Question:
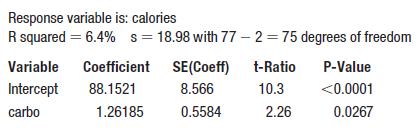
A regression of the calories in breakfast cereals on their carbohydrate content (g) looks like this:
A second regression with fiber content included gives this model: A second regression with fiber content included gives this model:
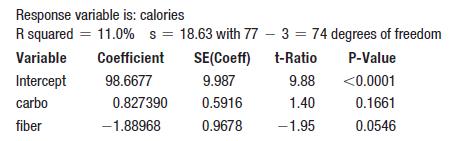
a) Give an interpretation of the coefficient of carbo in both regressions.
b) Why did the P-value on carbo change from 0.0267 in the first regression to 0.1661 in the second regression?
c) What statistics or graphs would you look at to understand this change?
Fantastic news! We've Found the answer you've been seeking!
Step by Step Answer:
a For the simple regression The model predicts that calories increase ...View the full answer

Answered By
Mwangi Clement
I am a tried and tested custom essay writer with over five years of excellent essay writing. In my years as a custom essay writer, I have completed more than 2,000 custom essays in a diverse set of subjects. When you order essays from me, you are working with one of the best paper writers on the web. One of the most common questions I get from customers is: “can you write my essay?” Upon hearing that request, my goal is to provide the best essays and overall essay help available on the web. I have worked on papers in subjects such as Nursing and Healthcare, English Literature, Sociology, Philosophy, Psychology, Education, Religious Studies, Business, Biological Sciences, Communications and Media, Physical Sciences, Marketing and many others. In these fields, my specialties lie in crafting professional standard custom writings. These include, but are not limited to: research papers, coursework, assignments, term papers, capstone papers, reviews, summaries, critiques, proofreading and editing, and any other college essays.
My extensive custom writings experience has equipped me with a set of skills, research abilities and a broad knowledge base that allows me to navigate diverse paper requirements while keeping my promise of quality. Furthermore, I have also garnered excellent mastery of paper formatting, grammar, and other relevant elements. When a customer asks me to write their essay, I will do my best to provide the best essay writing service possible. I have satisfactorily offered my essay writing services for High School, Diploma, Bachelors, Masters and Ph.D. clients.
I believe quality, affordability, flexibility, and punctuality are the principal reasons as to why I have risen among the best writers on this platform. I deliver 100% original papers that pass all plagiarism check tests (Turnitin, Copyscape, etc.). My rates for all papers are relatively affordable to ensure my clients get quality essay writing services at reasonable prices.
5+ Reviews
14+ Question Solved
Related Book For 

Intro Stats
ISBN: 9780134668420
5th Edition
Authors: Richard D De Veaux, Paul F Velleman, David E Bock, Nick Horton
Question Posted:
