

Exercise R5.41 looked at regressions to model calories in breakfast cereals based on their carbohydrates and fiber
Question:
Exercise R5.41 looked at regressions to model calories in breakfast cereals based on their carbohydrates and fiber content. Here is a scatterplot of carbohydrates vs. fiber content for these cereals:

The cereals plotted with green x’s are the three bran cereals in the data. How does this plot help explain the change in the coefficient of carbo seen in Exercise R5.41?
Data From Exercise R5.41
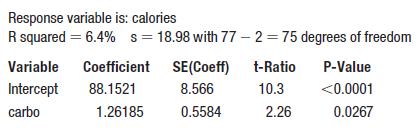
A regression of the calories in breakfast cereals on their carbohydrate content (g) looks like this:
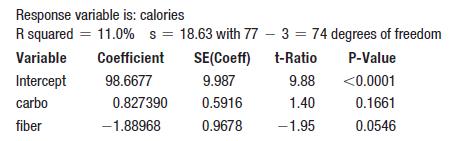
A second regression with fiber content included gives this model: A second regression with fiber content included gives this model:
Fantastic news! We've Found the answer you've been seeking!
Step by Step Answer:
These three cereals are highly influential ...View the full answer

Answered By
Raunak Agarwal
Teaching is my hobby and now my profession. I teach students of CA and CFA(USA) in batches of 100 students and have a 5 year experience.
1+ Reviews
10+ Question Solved
Related Book For 

Intro Stats
ISBN: 9780134668420
5th Edition
Authors: Richard D De Veaux, Paul F Velleman, David E Bock, Nick Horton
Question Posted:
