

Question: A second predictor in Exercise 13 improved the regression model of Exercise 1, so lets try a third. Heres a model with average ACT score
A second predictor in Exercise 13 improved the regression model of Exercise 1, so let’s try a third. Here’s a model with average ACT score of the entering class included:
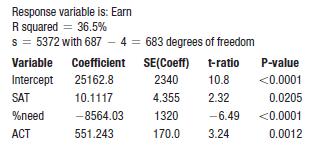
a) The coefficient of SAT in this model is quite different from the SAT coefficient in the original model of Exercise 1 or the multiple regression model of Exercise 13. Why the change?
b) Find a 95% confidence interval for the coefficient of SAT. How does it compare with the one you found in Exercise 13?
c) The t-ratio associated with the SAT coefficient is now much smaller and the corresponding P-value much larger.
Data From Exercise 13
Continuing with the data from Exercise 1, here’s a regression with the percent of students who receive merit-based financial aid included in the model:
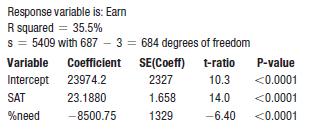
Response variable is: Earn R squared = 36.5% s = 5372 with 687 - 4 = 683 degrees of freedom Variable Intercept SAT %need ACT Coefficient 25162.8 10.1117 -8564.03 551.243 SE(Coeff) 2340 4.355 1320 170.0 3.24 t-ratio 10.8 2.32 -6.49 P-value
Step by Step Solution
3.53 Rating (156 Votes )
There are 3 Steps involved in it
a ACT and SAT are highly correlated with each other After all they are ve... View full answer

Get step-by-step solutions from verified subject matter experts