

Question: Continuing with the data from Exercise 1, heres a regression with the percent of students who receive merit-based financial aid included in the model: a)
Continuing with the data from Exercise 1, here’s a regression with the percent of students who receive merit-based financial aid included in the model:
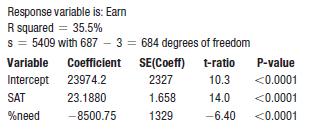
a) Write the regression model.
b) What is the interpretation of the coefficient of SAT in this model? How does it differ from the interpretation in Exercise 1?
Data From Exercise 1
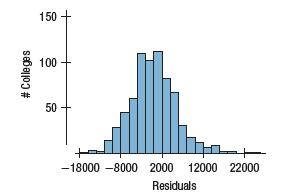
Does attending college pay back the investment? What factors predict higher earnings for graduates? Money magazine surveyed graduates, asking about their point of view of the colleges they had attended (Money’s Best Colleges at new.time.com/money/best-colleges/rankings/best-colleges/). One good predictor of early career earnings ($/year) turned out to be the average SAT score of entering students. Here are the regression model and associated plots. Write the regression model and explain what the slope coefficient means in this context.
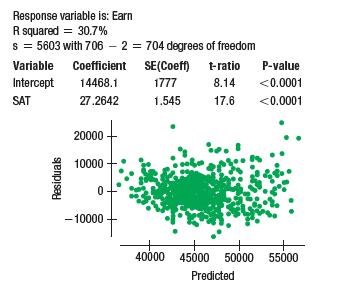
Response variable is: Earn R squared = 35.5% s = 5409 with 687 - 3= 684 degrees of freedom Variable Intercept SAT %need Coefficient SE(Coeff) 23974.2 2327 23.1880 1.658 -8500.75 1329 t-ratio 10.3 14.0 -6.40 P-value
Step by Step Solution
3.42 Rating (171 Votes )
There are 3 Steps involved in it
a b The model predicts that on average Goals is expected to i... View full answer

Get step-by-step solutions from verified subject matter experts