

Question: Consider once again the CO 2 and global temperature data of Exercise 41. The mean CO 2 level for these data is 352.566 ppm. a)
Consider once again the CO2 and global temperature data of Exercise 41. The mean CO2 level for these data is 352.566 ppm.
a) Find a 90% confidence interval for the mean global temperature anomaly if the CO2 level reaches 450 ppm.
b) Find a 90% prediction interval for the mean global temperature anomaly if the CO2 level reaches 450 ppm.
c) The goal of the Paris Climate agreement is equivalent to a temperature anomaly of about 1.3 °C in our data. If CO2 levels do reach 450 ppm, would this be a plausible value?
Data From Exercise 41
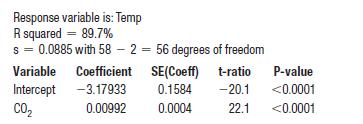
Data collected from around the globe (including the sea ice data of Exercise 23) show that the earth is getting warmer. The generally accepted explanation relates climate change to an increase in atmospheric levels of carbon dioxide (CO2) because CO2 is a greenhouse gas that traps the heat of the sun. A standard source of the mean annual CO2 concentration in the atmosphere (parts per million) is measurements taken at the top of Mauna Loa in Hawaii (away from any local contaminants) and available at ftp://aftp.cmdl.noaa.gov/ products/trends/co2/co2_annmean_mlo.txt. Global temperature anomaly is the difference in mean global temperature relative to a base period of 1981 to 2010 in °C. It is available at www.ncdc.noaa.gov/cag/data-info/global. Here are a scatterplot and regression for the years from 1959 to 2016:
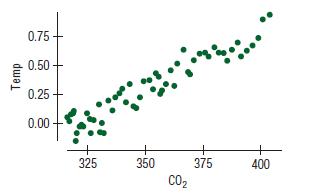
Temp 0.75 0.50 0.25- 0.00 325 + 350 CO 375 400
Step by Step Solution
3.42 Rating (165 Votes )
There are 3 Steps involved in it
a The regression equation predicts that a CO 2 level of 450 ppm will have a mean global temperature ... View full answer

Get step-by-step solutions from verified subject matter experts