

Question: Data from 50 large U.S. cities show the mean January Temperature and the Latitude. Describe what you see in the scatterplot. Avg. Jan. Temp (F)
Data from 50 large U.S. cities show the mean January Temperature and the Latitude. Describe what you see in the scatterplot.
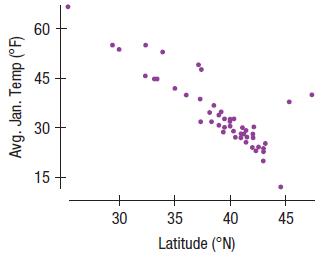
Avg. Jan. Temp (F) 60 45 30 + + 15+ 30 35 40 Latitude (N) 45
Step by Step Solution
★★★★★
3.44 Rating (163 Votes )
There are 3 Steps involved in it
1 Expert Approved Answer
Step: 1 Unlock

There is a strong roughly linear negative association b... View full answer
Question Has Been Solved by an Expert!
Get step-by-step solutions from verified subject matter experts
Step: 2 Unlock
Step: 3 Unlock