

Question: The data shown in the following scatterplot show a very nice relationship between the two variables. However, the correlation here is 0.03, very close to
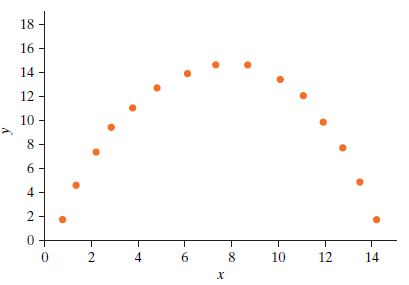
The data shown in the following scatterplot show a very nice relationship between the two variables. However, the correlation here is 0.03, very close to zero. Explain why we can have a nice relationship between two quantitative variables and yet have a correlation of 0.
18 16 14 12 10 8 4 2 4 8 10 12 14 6, 2.
Step by Step Solution
★★★★★
3.41 Rating (164 Votes )
There are 3 Steps involved in it
1 Expert Approved Answer
Step: 1 Unlock

The correlation coefficient measures the strength of the linear rela... View full answer
Question Has Been Solved by an Expert!
Get step-by-step solutions from verified subject matter experts
Step: 2 Unlock
Step: 3 Unlock