

Question: Exercise 41 of Chapter 6 looked at a sample of 35 vehicles to examine the relationship between gas mileage and engine displacement. The full data
Exercise 41 of Chapter 6 looked at a sample of 35 vehicles to examine the relationship between gas mileage and engine displacement. The full data set holds data on 1211 cars. How well did our sample of 35 represent the underlying relationship between displacement and fuel efficiency? If you can use the computer tools available, then draw many samples of 35 from the full data set (without replacement), find regression slopes, and comment on how much the slope values differ. If you don’t have access to the computer tools, here are the results we found for one such experiment.
Here is a histogram of the slopes of those lines with the middle 95% of them selected:
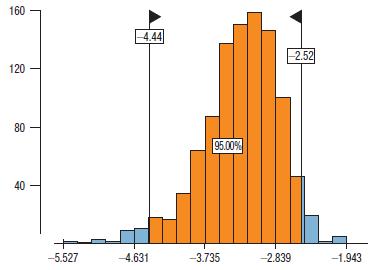
a) Describe how the sample slopes vary.
b) The sample in Chapter 6, Exercise 41 has a slope of -4.36. Is this typical of the slopes you found for such samples?
c) If you performed the experiment for yourself, how did your results differ from those reported here?
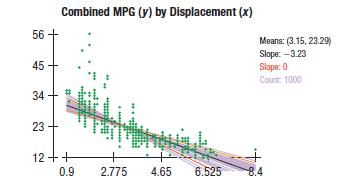
Data From Exercise 41
Consider the Albuquerque home sales from Exercise 29 again. The regression analysis gives the model ![]()
56 45 34 + 23+ Combined MPG (y) by Displacement (x) 12++ 0.9 ****** stogoff 2.775 4.65 6.525 Means: (3.15, 23.29) Slope: -3.23 Slope: 0 Count: 1000 8.4
Step by Step Solution
3.38 Rating (160 Votes )
There are 3 Steps involved in it
Solution a The sample of 35 very lowdisplacement vehicles had an average slop... View full answer

Get step-by-step solutions from verified subject matter experts