

Question: data file Receivers 2015 holds information about the 488 NFL players who caught at least one pass during the 2015 football season. A typical 53-man
data file Receivers 2015 holds information about the 488 NFL players who caught at least one pass during the 2015 football season. A typical 53-man roster has about 13 players who would be expected to catch passes (primarily wide receivers, tight ends, and running backs). We’ll examine the relationship between the number of Yards gained during the season and the number of Receptions. If you have the computer tools available, then draw samples of 13 from the full data file (without replacement) and find the slope of the regression of Yards on Receptions for each sample. If you don’t have access to the computer tools, here are the results we found for one such experiment.
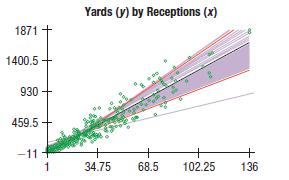
Here are plots showing the 500 slopes we found:
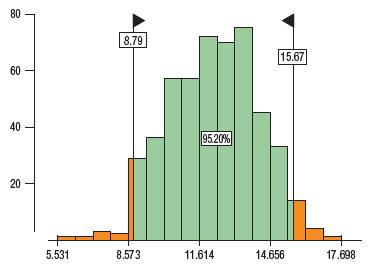
Here is a histogram of the slopes of those lines with the middle 95% of them selected:
a) Describe how the sample slopes vary.
b) How would you interpret the meaning of a slope in the regression of Yards on Receptions?
c) Based on your answer in part b, what might you advise an NFL coach to expect from his 13 receivers in the course of the season?
1871 + 1400.5 930 459.5 + -11+ 1 Yards (y) by Receptions (x) 34.75 68.5 102.25 136
Step by Step Solution
3.35 Rating (179 Votes )
There are 3 Steps involved in it
a The distribution of the slopes is unimodal and symme... View full answer

Get step-by-step solutions from verified subject matter experts