

Question: Exercise R2.7 examined the correlation between BCI and pH in streams sampled in the Adirondack Mountains. Here is the corresponding regression model: a) Write the
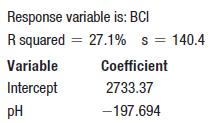
Exercise R2.7 examined the correlation between BCI and pH in streams sampled in the Adirondack Mountains. Here is the corresponding regression model:
a) Write the regression model.
b) What is the interpretation of the coefficient of pH?
c) What would you predict the BCI would be for a stream with a pH of 8.2?
Data From Exercise R2.7
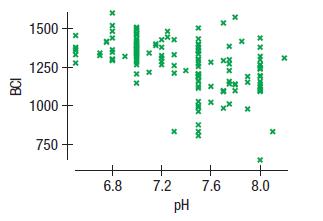
Biologists studying the effects of acid rain on wildlife collected data from 163 streams in the Adirondack Mountains. They recorded the pH (acidity) of the water and the BCI, a measure of biological diversity, and they calculated R2 = 27%. Here’s a scatterplot of BCI against pH:
Response variable is: BCI R squared = 27.1% s = 140.4 Variable Intercept pH Coefficient 2733.37 -197.694
Step by Step Solution
3.40 Rating (166 Votes )
There are 3 Steps involved in it
a The association between pH and BCI is negative moderate and linear Generally higher p... View full answer

Get step-by-step solutions from verified subject matter experts