

Exercise R2.9 fit a regression model to the relationship between BCI and pH in streams sampled in
Question:
Exercise R2.9 fit a regression model to the relationship between BCI and pH in streams sampled in the Adirondack Mountains. More variables are available. For example, scientists also recorded the water hardness. Here’s a new model:
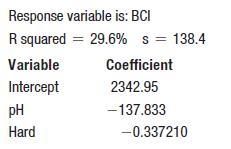
a) Write the regression model.
b) Is this a more successful model (for example, will it provide better predictions) than the model of Exercise R2.9?
c) What would you predict the BCI would be for a stream with a pH of 8.2 and a hardness value of 205?
d) There is such a stream in the data. Its BCI is 1309. What is the difference between your prediction of part c and the observed value? What is that called?
e) What is the interpretation of the coefficient of pH in this regression?
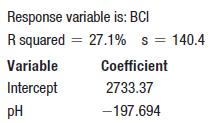
Data From Exercise R2.9
Exercise R2.7 examined the correlation between BCI and pH in streams sampled in the Adirondack Mountains. Here is the corresponding regression model:
Step by Step Answer:
a The regression model that predicts BCI from pH a...View the full answer


Intro Stats
ISBN: 9780134668420
5th Edition
Authors: Richard D De Veaux, Paul F Velleman, David E Bock, Nick Horton
