

Question: Here is a stem-and-leaf display showing profits (in $M) for 30 of the 500 largest global corporations (as measured by revenue). The stems are split;
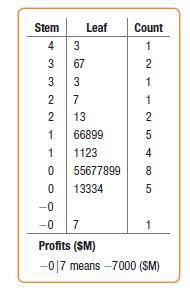
Here is a stem-and-leaf display showing profits (in $M) for 30 of the 500 largest global corporations (as measured by revenue). The stems are split; each stem represents a span of 5000 ($M), from a profit of 43,000 ($M) to a loss of 7000 ($M). Use the stem-and-leaf to answer the questions.
a) Find the 5-number summary.
b) Draw a boxplot for these data.
c) Find the mean and standard deviation.
d) Describe the distribution of profits for these corporations.
Stem 43322 4 2 2 1 1 0 0 -0 3 67 3 Leaf 7 13 66899 1123 55677899 13334 Count 1 2 1 1 2 54 2 5 4 8 CO 5 --07 Profits (SM) -017 means -7000 (SM) 1
Step by Step Solution
3.52 Rating (165 Votes )
There are 3 Steps involved in it
a The 5number summary of the profits in billions of dollars of 30 of ... View full answer

Get step-by-step solutions from verified subject matter experts