

Question: Later on, the forester in Exercise 39 shows you a histogram of the tree diameters he used in analyzing the woods that was for sale.
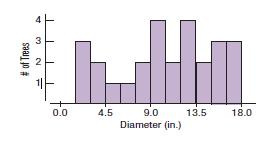
Later on, the forester in Exercise 39 shows you a histogram of the tree diameters he used in analyzing the woods that was for sale. Do you think he was justified in using a Normal model?
Data From Exercise 39
A forester measured 27 of the trees in a large woods that is up for sale. He found a mean diameter of 10.4 inches and a standard deviation of 4.7 inches. Suppose that these trees provide an accurate description of the whole forest and that a Normal model applies.
a) Draw the Normal model for tree diameters.
b) What size would you expect the central 95% of all trees to be?
c) About what percent of the trees should be less than an inch in diameter?
d) About what percent of the trees should be between 5.8 and 10.4 inches in diameter?
e) About what percent of the trees should be over 15 inches in diameter?
A 3 # of Trees N 0.0 4.5 Ho 13.5 9.0 Diameter (in.) 18.0
Step by Step Solution
3.41 Rating (176 Votes )
There are 3 Steps involved in it
Thorough and long solution From the histogram of the tree diameters it does not appear that a Normal ... View full answer

Get step-by-step solutions from verified subject matter experts