

In a data set of 1057 New York homes offered for sale, a histogram of the ages
Question:
In a data set of 1057 New York homes offered for sale, a histogram of the ages looks like this:
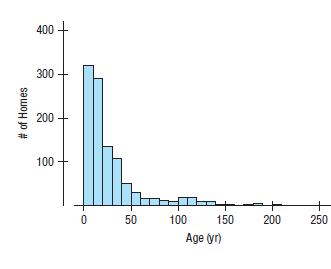
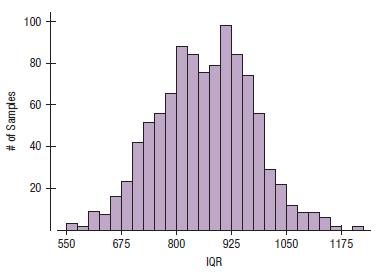
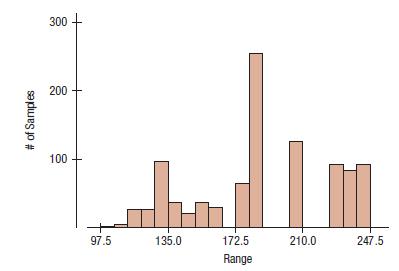
We drew 1000 samples of 105 homes from this data set and found the IQR and the range of each sample. Below are histograms of the 1000 IQRs and 1000 ranges. For which of these distributions would you use the 68–95–99.7 Rule?
Fantastic news! We've Found the answer you've been seeking!
Step by Step Answer:
The distribution of the IQR of home age for samples of 10...View the full answer

Answered By
Jinah Patricia Padilla
Had an experience as an external auditor in Ernst & Young Philippines and currently a Corporate Accountant in a consultancy company providing manpower to a 5-star hotel in Makati, Philippines, Makati Diamond Residences
120+ Reviews
150+ Question Solved
Related Book For 

Intro Stats
ISBN: 9780134668420
5th Edition
Authors: Richard D De Veaux, Paul F Velleman, David E Bock, Nick Horton
Question Posted:
