

Question: In Chapter 4, Exercise 38, we saw an ogive of the distribution of cholesterol levels (in mg/dL) of a random sample of 1406 participants (taken
In Chapter 4, Exercise 38, we saw an ogive of the distribution of cholesterol levels (in mg/dL) of a random sample of 1406 participants (taken in 1948 from Framingham, MA). To find a bootstrap confidence interval for the mean cholesterol, a student took 1000 bootstrap samples, calculated the mean of each, and found the following histogram of the bootstrap means:
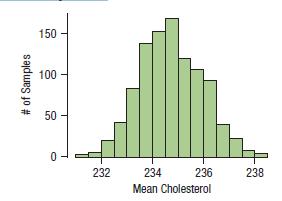
Summary statistics of the means show:
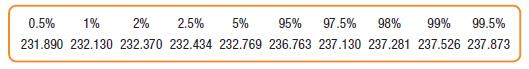
a) Use the data above to construct a 95% confidence interval for the mean cholesterol.
b) Interpret the interval you constructed in part a.
c) What assumptions did you make, if any, in interpreting the interval?
Data From Chapter 4 Exercise 38
The Framingham Heart Study recorded the cholesterol levels of more than 1400 participants. (Data in Framingham) Here is an ogive of the distribution of these cholesterol measures. (An ogive shows the percentage of cases at or below a certain value.) Construct a boxplot for these data, and write a few sentences describing the distribution.

# of Samples 150 100 50 0 L 232 234 236 Mean Cholesterol 238
Step by Step Solution
3.45 Rating (165 Votes )
There are 3 Steps involved in it
a To find a 95 confidence interval for the mean we need to exclude the most extreme 5 of ... View full answer

Get step-by-step solutions from verified subject matter experts