

Question: Framingham revisited In Chapter 4, Exercise 38, we saw an ogive of the distribution of cholesterol levels (in mg/dL) of a random sample of 1406
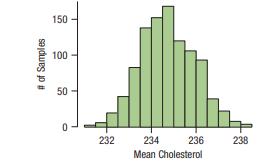
Framingham revisited In Chapter 4, Exercise 38, we saw an ogive of the distribution of cholesterol levels (in mg/dL) of a random sample of 1406 participants (taken in 1948 from Framingham, MA). To find a bootstrap confidence interval for the mean cholesterol, a student took 1000 bootstrap samples, calculated the mean of each, and found the following histogram of the bootstrap means:
a) Use the data above to construct a 95% confidence interval for the mean cholesterol.
b) Interpret the interval you constructed in part a.
c) What assumptions did you make, if any, in interpreting the interval?
d) Repeat the experiment for yourself with the bootstrap tool
# of Samples 150 100 50 50 0 232 234 236 238 Mean Cholesterol
Step by Step Solution
There are 3 Steps involved in it

Get step-by-step solutions from verified subject matter experts