

Question: In Chapters 4 and 6 weve seen data from the Hopkins Forest. Heres a regression that models the maximum daily wind speed in terms of
In Chapters 4 and 6 we’ve seen data from the Hopkins Forest. Here’s a regression that models the maximum daily wind speed in terms of the average temperature and precipitation:
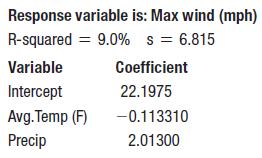
a) Write the regression model.
b) What is the interpretation of the coefficient of Precip?
Here is the partial regression plot for the coefficient of Precip in the regression:
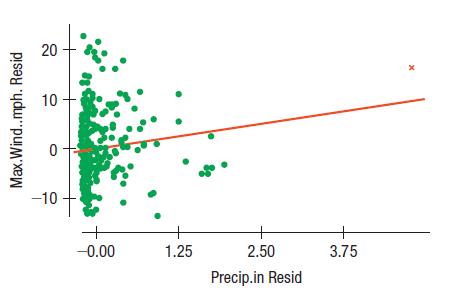
c) What is the slope of the least squares regression line in the partial regression plot?
d) The point plotted with an “x” is for 8/28/2011—the date of Hurricane Irene. If we were to remove it from the data, what would happen to the coefficient of Precip?
Response variable is: Max wind (mph) R-squared = 9.0% s = 6.815 Variable Intercept Avg. Temp (F) Precip Coefficient 22.1975 -0.113310 2.01300
Step by Step Solution
3.38 Rating (145 Votes )
There are 3 Steps involved in it
a b After allowing for AvgTemp a 1inch increase in rainfall ... View full answer

Get step-by-step solutions from verified subject matter experts