

The 3-month Treasury bill interest rate is watched by investors and economists. Heres the scatterplot of the
Question:
The 3-month Treasury bill interest rate is watched by investors and economists. Here’s the scatterplot of the 3-month Treasury bill rate since 1934 that we saw in Exercise 43:
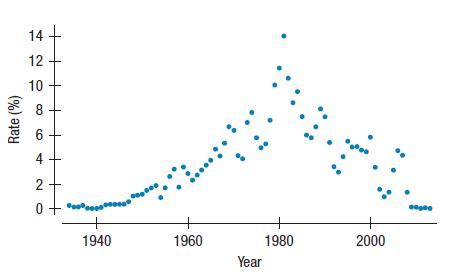
Clearly, the relationship is not linear. Can it be made nearly linear with a re-expression? If so, which one would you suggest? If not, why not?
Data From Exercise 43
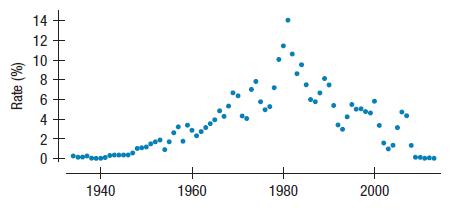
In Exercise 41, you investigated the federal rate on 3-month Treasury bills between 1950 and 1980. The scatterplot below shows that the trend changed dramatically
after 1980, so we computed a new regression model for the years 1981 to 2015.
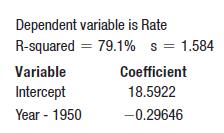
Here’s the model for the data from 1981 to 2015 (in years since 1950):
Step by Step Answer:
we have given x independent variable Year and y dependent variable Rate we ...View the full answer


Intro Stats
ISBN: 9780134668420
5th Edition
Authors: Richard D De Veaux, Paul F Velleman, David E Bock, Nick Horton
